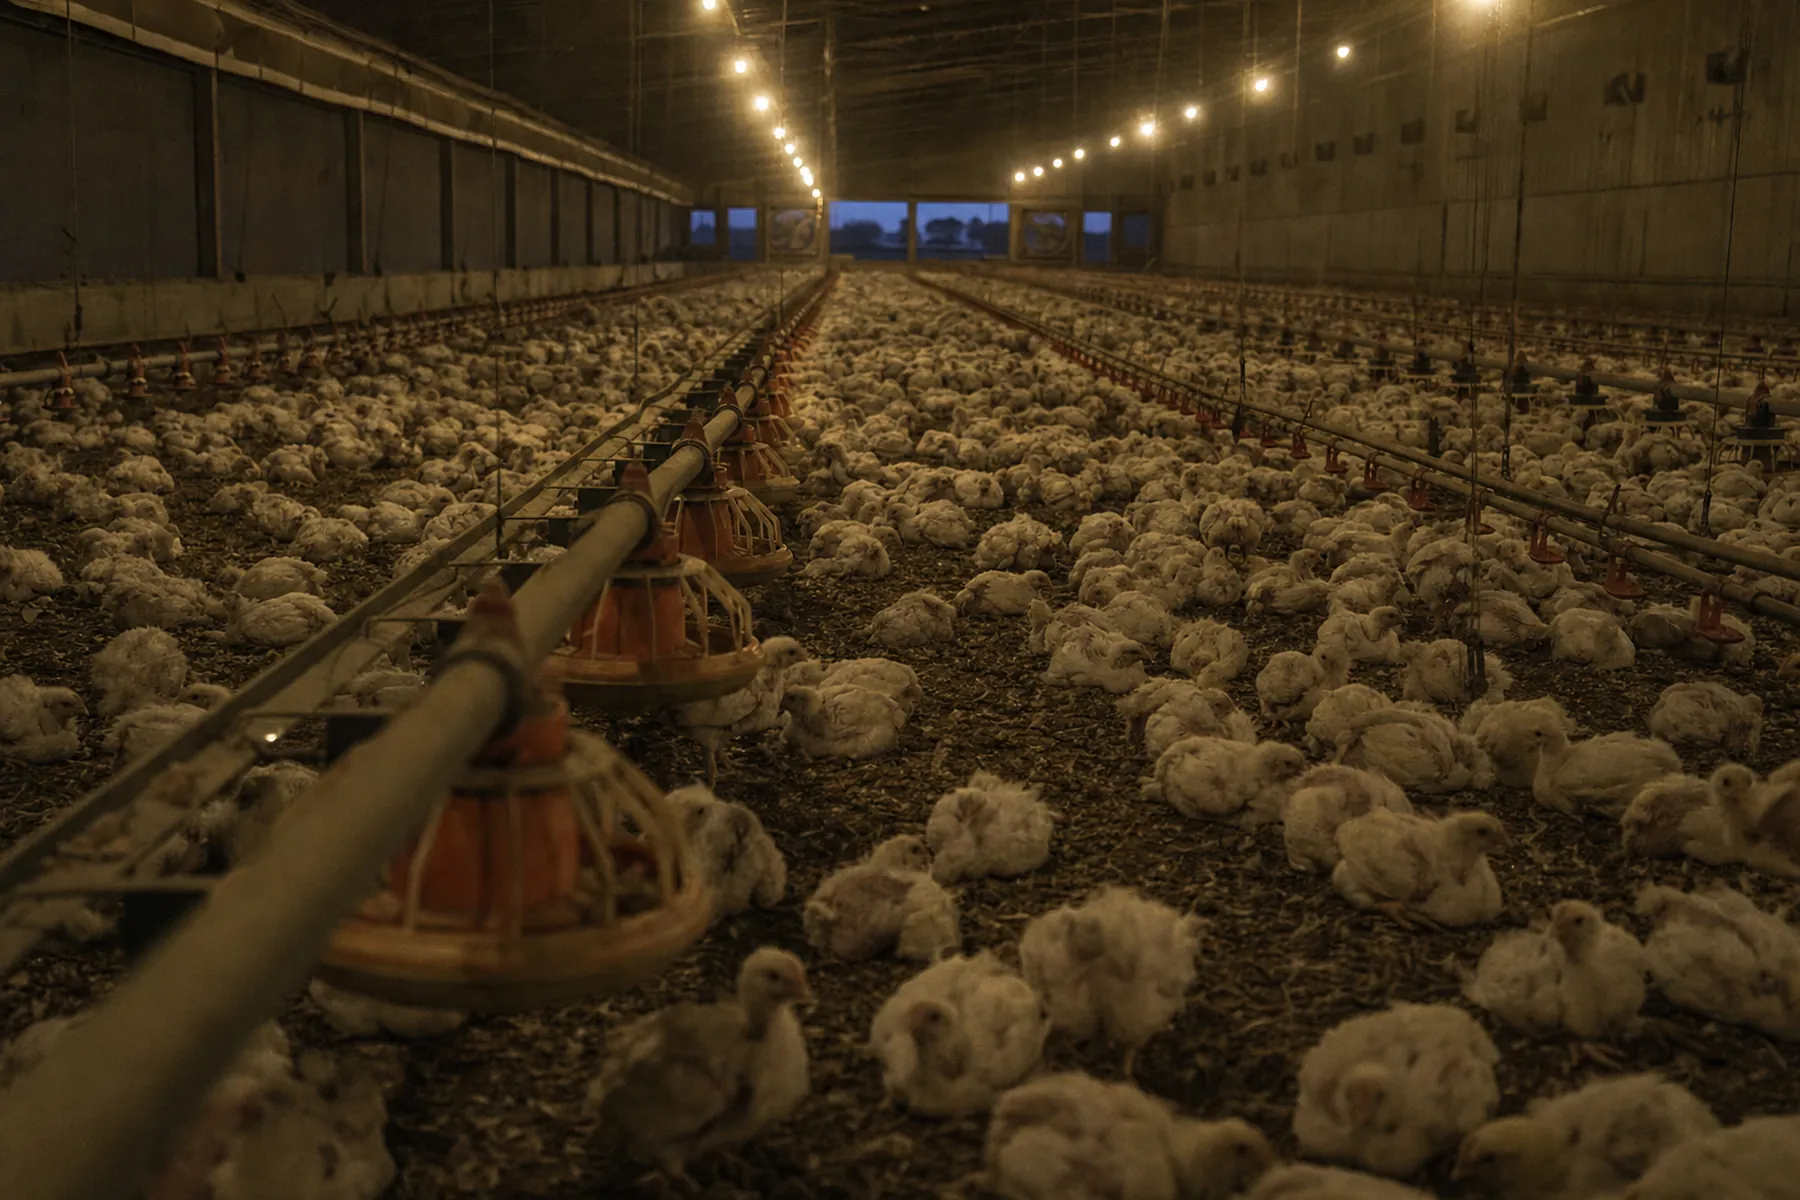
Most flock problems are visible in the numbers before they are visible in the house.
PoultraIQ builds early-warning software for poultry operations. Our first product, PoultraIQ Daily, reads the log you already keep and tells you when something has started to drift.
The sensors are already in the house. The judgment isn’t.
USDA found integrated electronic controls in 84% of broiler houses in 2011, and in every house built that year. The sensing layer is not the gap. What sits above it is. In a 2024 survey of Tennessee broiler producers, 57% reported using no computer software to capture, review, or manage farm operational data, and 25% used a data-management system.
The result is that a great deal of useful signal is captured every day and then never compared to anything. A mortality count that is 30% above the last seven days looks like an ordinary number on an ordinary sheet. By the time it looks like a problem, it usually is one.
Controls — USDA ERS EIB-126, 2011 ARMS, 66,680 houses across 17 states. Software — Klingberg, T. (2025), University of Tennessee: 77 respondents, Tennessee only, 14.5% response rate. Mortality — National Chicken Council. How we read this evidence →
PoultraIQ Daily
A daily house log that watches itself. You enter what you already record — mortality, feed, water, temperature, humidity, a note. PoultraIQ Daily compares every entry against the rolling average of the prior seven days and flags what falls outside the pattern, with the reason stated in plain language.
- No hardware
- Works on day one with manual entry. No sensors to buy, install, or maintain.
- Explained flags
- Every alert says what moved, by how much, and against what baseline.
- Cycle memory
- Entries, flags, and notes stay attached to the flock and the cycle, so the next crew starts informed.
Scroll the table sideways to see all columns
| Date | Mortality | Feed (lb) | Water (gal) | Temp °F | Flags |
|---|---|---|---|---|---|
| D-12 | 11 | 3,920 | 980 | 84 | — |
| D-11 | 9 | 3,980 | 995 | 83 | — |
| D-10 | 13 | 4,010 | 1,005 | 83 | — |
| D-9 | 10 | 4,050 | 1,010 | 82 | — |
| D-8 | 12 | 4,080 | 1,020 | 82 | — |
| D-7 | 8 | 4,100 | 1,030 | 81 | — |
| D-6 | 10 | 4,120 | 1,040 | 81 | — |
| D-5 | 11 | 4,150 | 1,045 | 80 | — |
| D-4 | 9 | 4,180 | 1,055 | 80 | — |
| D-3 | 34 | 3,540 | 860 | 80 | HIGH |
| D-2 | 14 | 4,050 | 1,000 | 79 | — |
| D-1 | 10 | 4,210 | 1,075 | 79 | — |
Mortality — 34 birds, 240% above the 10.0 average from the prior 7 days.
Water intake — dropped 17% below the 7-day average of 1,031 gal.
NOTE — Found wet litter near west feed line, checked ventilation
Operators who capture their own upside.
Independent producers
You own the birds and the outcome. Every point of feed conversion and every avoided mortality event is yours.
Multi-house operators
Four, eight, or more houses under one manager. The problem is not knowing what happened; it is noticing it across every house on the same morning.
Regional integrators
Smaller and mid-sized integrators without a proprietary grower platform, looking for something their growers will actually open.
Before the software, there is the problem.
PoultraIQ also works directly with equipment manufacturers, sensor companies, AI teams, and research groups that need poultry-domain judgment — the difference between a promising demonstration and something that survives dust, washdown, a 4am equipment failure, and a grower who has ninety seconds to look at it.
We would rather be measured than believed.
PoultraIQ is actively seeking university extension partners, land-grant poultry science programs, and grower cooperators for structured pilots of PoultraIQ Daily. The goal is a documented, third-party result on detection lead time — a number the industry does not currently have.
Bring us a house and a problem.
The most useful first conversation describes what you run, what you already record, and what you wish you had known sooner.